European GPS-disturbance: multi-faceted
GNSS-disturbances over Europe of last months are multi-faceted. In this thread I will try and make sense of it with much help from @lemonodor and @benelsen.
The outage of a single GPS-satellite has caused repeated widespread but very short disturbances.
Mostly synced to this, sometimes not, there has been more disturbance not easily explained by the above. By me interpreted as jamming.
+ other peculiarities and false positives.
Video shows selected dates, legend: Blue figures: jamming/spoofing-areas. Flashes of intensity: GPS sat outage. Rest: likely false positives.
Intro
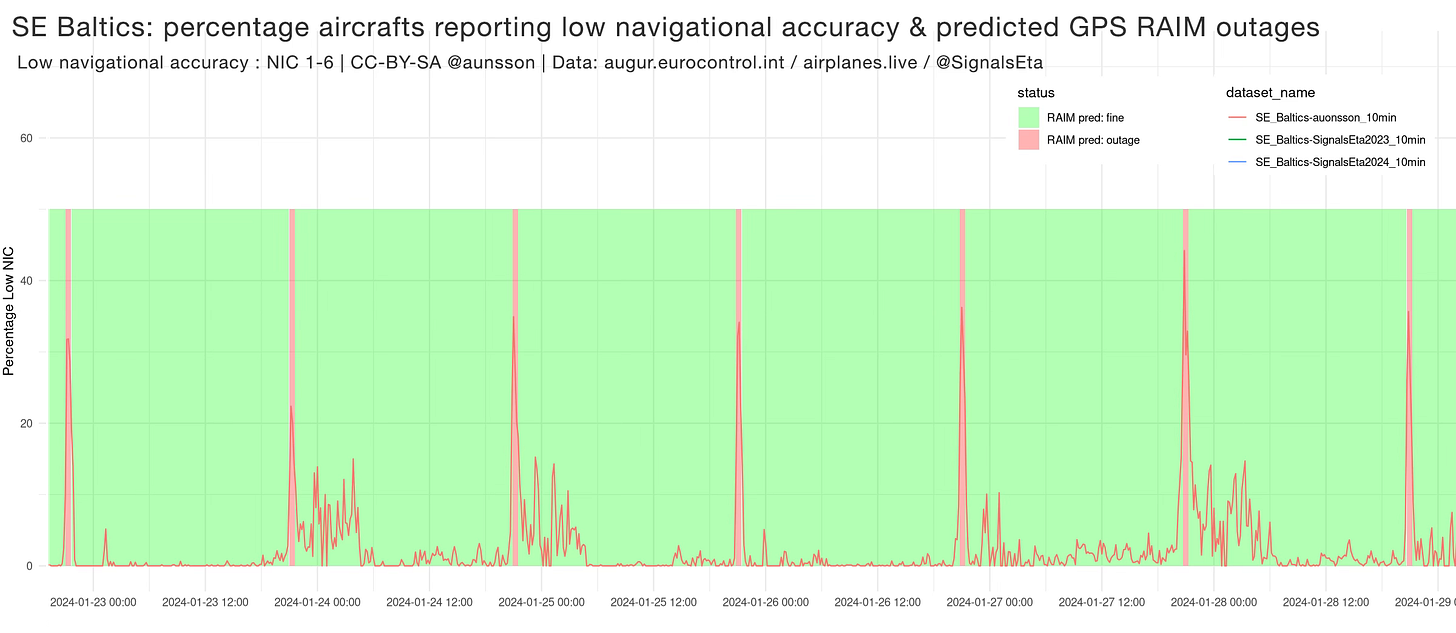
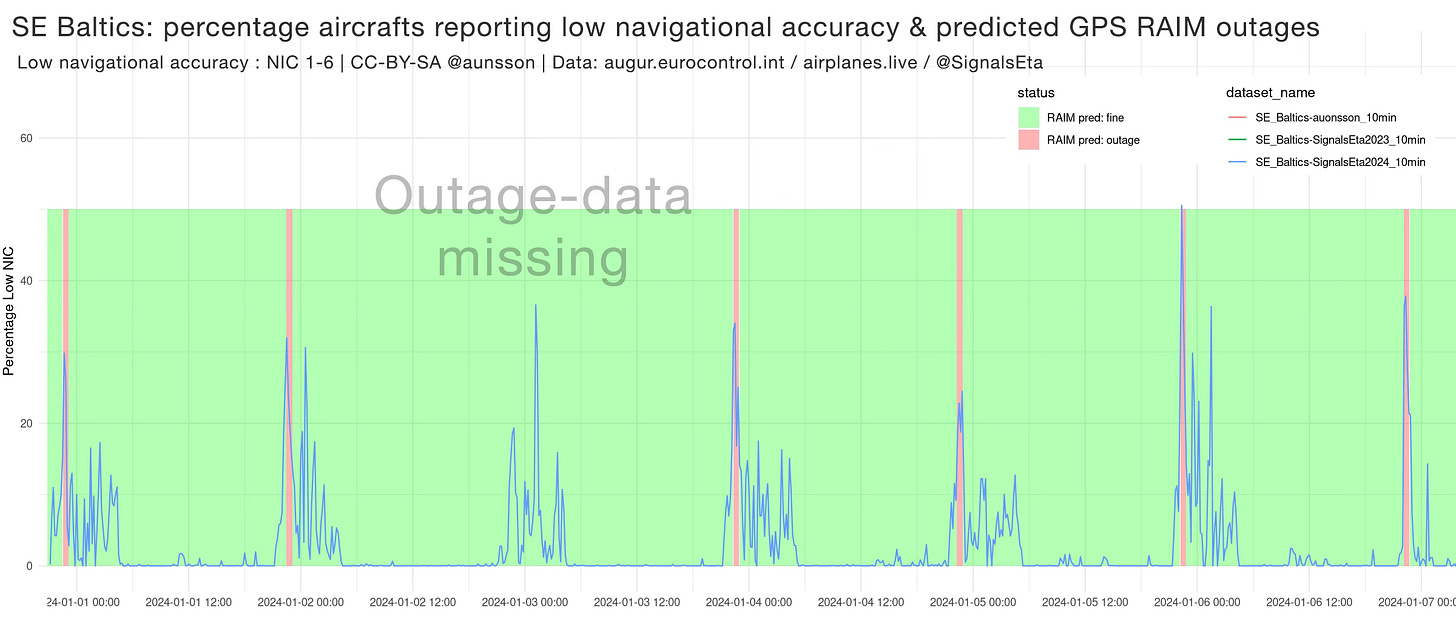
This is a close to complete time-line showing both the Baltic Jammer, the sat outages and the synced/not synced disturbance. Baltics only! I had some trouble syncing the week-plot data, but click the very wide picture to get the entire period, synced.


Note that I in this post switch study areas. All plots are based on the areas below, which I call South East Baltics. All RAIM-predictions are Gdansk Airport (EPGD) only. The animations differ from this, self-explanatory. Here a post on why I chose the metrics I use.
The precision of GPS is a large subject. I am simplifying it in my work by calling low NIC bad quality/accuracy. It is more complex than that but I think that it suffices for our cause. Read more here: https://gssc.esa.int/navipedia/index.php/Integrity
The nice animations made by @benelsen are based on data from https://www.navcen.uscg.gov and methods in “Kaplan & Hegarty - Understanding GPS/GNSS: principles and applications”1
Jamming != sat effects
Let’s dig in and start with an interesting 24h in January 23-24. In this short clip you see a predicted low GPS quality event causing low nav quality for aircrafts. The GPS satellite svn66/prn27 is out of order (unkown why to me) and is the cause of this widespread nav disturbance.
If we zoom out a bit though, looking at the full 24h it is apparent there are many processes happening. (Timing and exact borders approximate)
There is the well known Black Sea spoof/jam hotspot (also causing flights to lose nav accuracy as they fly across Europe, eg https://x.com/auonsson/status/1747354148658466938?s=20). There is a short blip in Spain and a very large one all over (sat caused GPS-disturbance) and then there are the Baltic and the Estonian jammers.
Here is the full 24h with predicted disturbance. So, the big event and the Spain blip is explained by one GPS-satellite not being available, but Black and Baltic sea disturbance is not. There are also plenty of false positives, some (eg UK) is just sport-planes reporting low values (my metrics need sharpening).
Here, the same Baltic event and some days around it, but in a plot. The red blocks are predicted outage for Gdansk, the line is % affected aircrafts in SE Baltics. The effect start synced most days, but can only be explained by prediction the first few minutes. Many nights it continues far longer.
EUROCONTROL is buggy
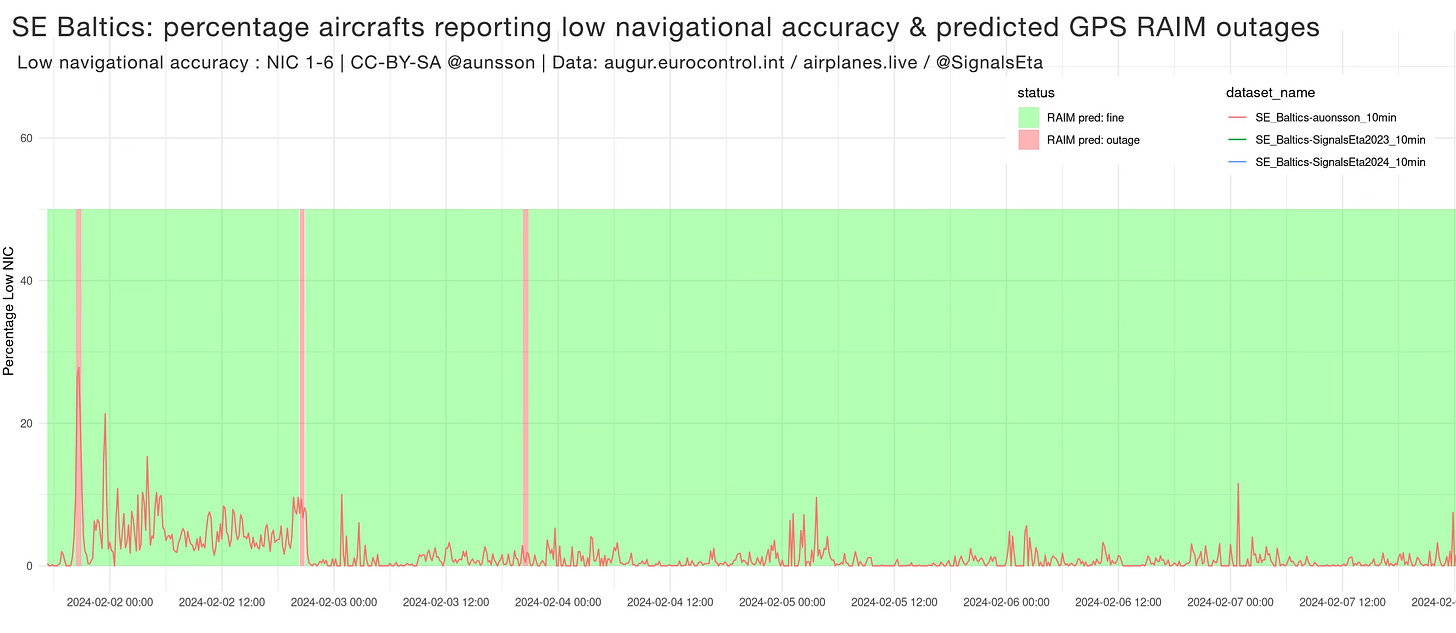
Feb 2-3 is interesting in another way. My Baltic plot shows no serious event, nor does animated prediction. But the prediction by augur.eurocontrol.int/tool/ shows an outage. I think this is just a bug with Eurocontrol, following pic shows another date where there ought to be a predicted outage but it is not. That site is in general very buggy.
And this predicted Feb 3 that event never happened.
Satellite is fine, now what?
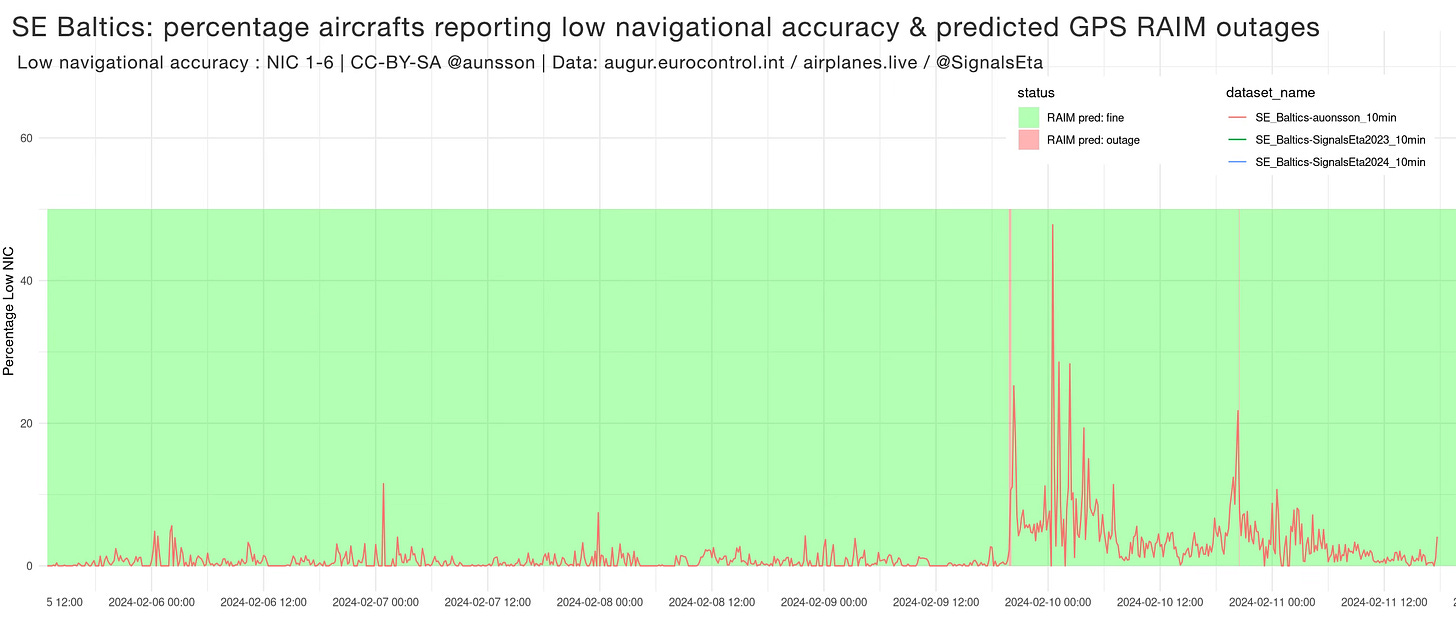
So, we have predicted satellite outages coinciding with affected aircrafts Dec 30 to Feb 2 but what about before and after? Nope, cant explain the aircrafts affected in SE Baltics. This is December, assumed normal level (0-2%) and large events of disturbance without any predicted satellite caused GPS-degradation.
Since Feb 4 there has been low grade effect in play most of the time, higher than December baseline, and high grade since evening Feb 10, not explained by predicted outages.
The entire December up until 30th is similar. According to augur.eurocontrol.int/tool/ there are no predicted outages (in Gdansk) but there are plenty of events with zero-levels in between. Timeline shows data for 25th and forward, map shows parts of the massive 25-27th event.


Yet, the affected aircrafts show no correlation (imho) to predicted GPS quality as seen in the predicted GPS-quality animation.
What now?
There is likely also a global effect, but that is for another post. Given last days news of suspected novel Russian space-based weapons (rumoured to be nuclear powered electronic warfare) this seems like an urgent investigation.
This is an open discussion, anyone willing to add please do so. Also note that I am an amateur in this field (not in science though). I will likely make mistakes and will misinterpret data. I did misinterpret the spikes that turned out to be caused by satellite issues, ie another process than the jammers.
Moore T. Understanding GPS/GNSS: Principles and Applications, Third editionEdited by E. D. Kaplan and C. J. Hegarty Artech House, 16 Sussex Street, London, SW1V 4RW, UK. 2017. xxi; 993pp. Illustrated £155 ISBN 978-1-63081-058-0. The Aeronautical Journal. 2019;123(1266):1323-1323. doi:10.1017/aer.2019.98


